← Back to Main
System Art: Visual State and System State
2/17/2025, 10:46:59 AM | Jeanyoon Choi
Original Notes (Pre-LLM)
There are already lots of 'system's or 'networks' within audio-visual compositions… TouchDesigner itself is the most representative node-based audio/visual system-network. But these are abstractive audio-visual based and come with limitations when talking about semantics/other visual interfaces rather than abstractive a/v.
When constructing multi-layered system art, there can be lots of approaches - but one of the possible approaches is to reference existing 'systems'. (This might act as a good starting point rather than 맨땅에 헤딩)
There are already lots of 'visual states' in existing 'audio/visual systems - compositions' - Some real-time, some interactive - especially within touchdesigner, but also appeared in kinetic art. For touchdesigner, they are literally node-based system where input and network combination creates an audio-visual output - a composition of states - and therefore no matter how the output a/v appears to be complex - it is composed of states, and if the input variable changes, than the output changes accordingly. Similar to kinetic art - usually employs a combination of unit modules (lights are the most conventional) and its 'states' turn on, off, intensity, etc… And this modular combination creates a whole system. Which is again, composed as a combination of states.
In interactive/computational art, it is important to analyse these states and compose complex systems based on the repetition and modularisation of these states. I think this rule for composing audio-visual networks can be also similarly used for systematic/semantic arts - It's just the domain that it's different, but the foundation remains the same.
Also association btw system-semantic state and visual state is quite important as you will need to eventually express/plot the systematic state into visual/audio-visual format. Understanding and composing this interconnection carefully is crucial.
For example, there are lots of employment of boolean states in traditional visual states - Kinetic light on-off most representatively. Also in the systematic state - imagine multiple grids with each being a module. Modules might be turned on <-> off repetitively to create an overall visual composition. Or switching between different states: ≠ employs this technique quite effectively. (≠ had a bit more complex inner states though) B <-> W bg composition is also one of the most representative way of plotting. Semantically, there are lots of situation where we need to use boolean/turn on <-> off/binary systems to depict the module's inner-state, so this strategy might be effective.
These discrete states (0/1) can be expanded to (0-n) discrete states: State A, B, C. For Example: A single unit of the semantic system might have three different states. This might correspond to the selection of R, G, B channels, for example when visualising. If there are 4 states - visually use N/S/W/E.
What about continuous states/continuous variables? Visual State: Intensity. System state: Lots of occasions when you have to plot conti' numerical value, like monetary value ($), representatively. Also important to plot this conti systematic value visually - use a different intensity of colours, space, angle, etc. Data sonification is also a useful answer. Also you can use a threshold to make the conti variable into boolean – If the (V > Threshold) (true/false).
The most representative example – Space Odyssey scene when HAL is killing sleeping pilots - how the texts turns into 'system malfunction' and the graph responds to this change - is a good way of how visual state and system state combined.
Here we talked about relatively simple states, individual module-based states. However, a more complex system is possible once we find out the clear association between visual state and system state - recall how touchdesigner have so much of a complicated visual system and network - the semantic system should follow the same trace.
For this association/expansion towards the complicated system to be possible, as of TouchDesigner's network, we need to build a similar system - a sort of a network for the system art - which I will reference more to the Graph Theory G(V, E) structure. V → State/Node, E → Edge/relationship.
V → Input nodes, Systematically pre-set nodes, context nodes, etc.
E → Relationship btw nodes, defining the relationship
Note that this is very high-level conceptual approach, not really going to the node-based structure itself…
That does not mean that the system art should necessarily have a node-based structure - I think the foundation might stick the same, but its graphical structure should be different from the TouchDesigner's node-based structure/node-based UI. Because these system art's graph art is a CONCEPTUAL one. Still need to further define the relationship between the mathematical graphs and system art…
Let's also talk about the conversion of 'ingredients' – Audio/visual art has literally audio and visual elements as their ingredients. For System state it can be extend to
Texts (Lots of people doing this already)
Numbers (As of the case of Present Shock - UVA)
Generative Images/Videos (Also easy to think of - lots of people doing this)
Graphs (Bar/Chart/Dashboard/Combined)
Websites
Commercial UIs - Advertisement, Business Card, Flight Information, Chatting UIs
Maps (Multiple Maps or Single Map and multiple modalities)
Avatar/Profile/Agent
Complex Networks
3D Structure (Modular - just like SoTA)
And any other thing that can be possible composed/widely communicated within web frameworks..
And these ingredients can have states - just as visual elements have states. This might offer a good starting point.
THOUGHT-EXPERIMENT: ONE EXAMPLE
Abstractive/Conceptual Example about the time (linearity of time)
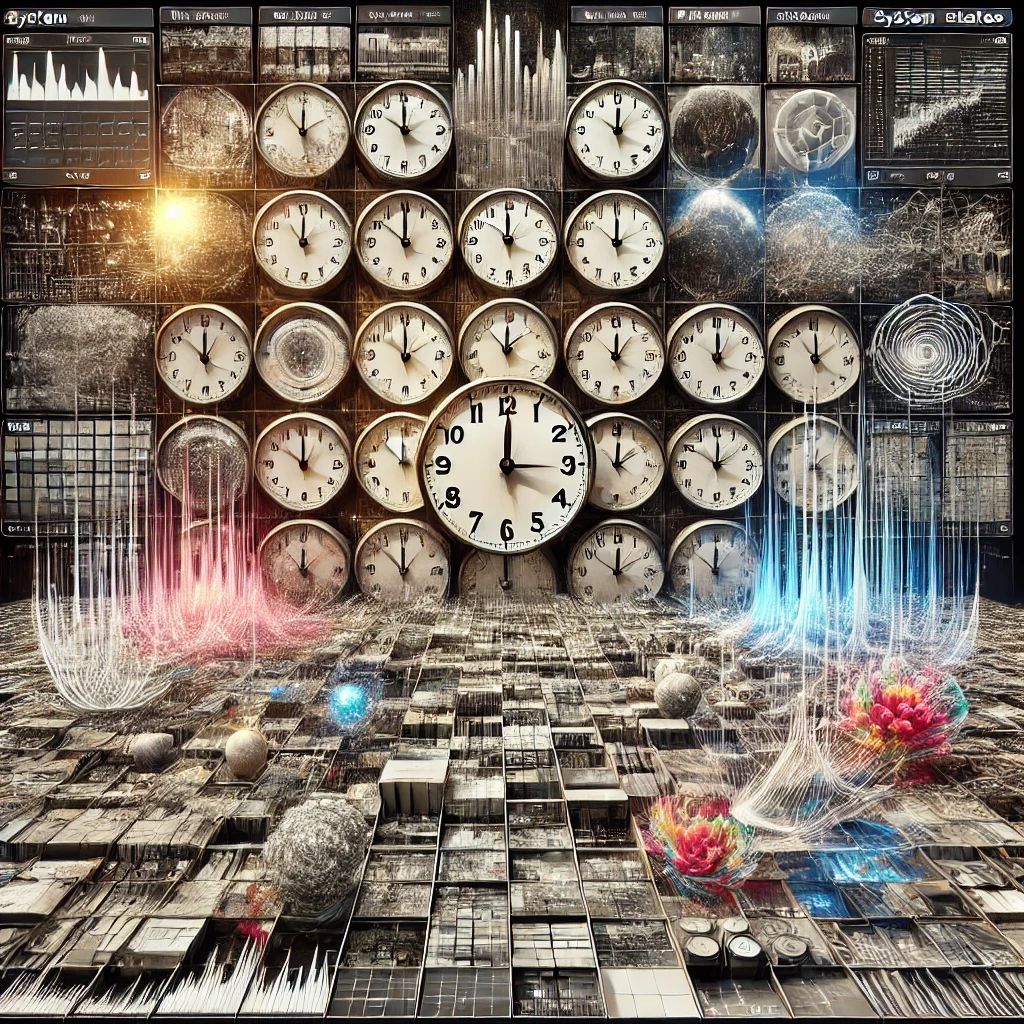
Aesthetic: Grid Layout, All modules first initially a digital clock HH:MM
HH:MM
INITIALLY: HH:MM synced with real time
AS PEOPLE INTERACTS: (IDK WHAT exactly the interaction will be) but the gradient/speed of time starts to differ based on the coordinate of the time module (x, y)
→ This different speed indicates the non-linearity of time and distortion in a spatial-temporal dimension, tilted based on the interaction
AS INTERACTION INTENSIFIES: The digital time display HH:MM starts to change (differs from module) into 1) analogue clock, 2) different design of digital clocks, 3) generative images/audios, 4) graphs, 5) clocks presented in different visual design elements (reference to christian marclay), etc…. And this is presented chaotically… based on the different speed/role that each timer module is playing
AS INTERACTION END/USER LEAVES: Each time module gradually moves back to the original setting (digital clock HH:MM synced with real time)
IF MULTIPLE USER PLAYS IN SAME TIME: It amplifies the interaction. This example is based on a state-based approach rather than traditional linear/progressive storytelling. (Multiple) Interactions can be amplified/disamplified - interfered - just as how two or more waves interfere. It is up to multiple users interacting simultaneously on how they will control this: A WAVE INTERFERENCE. AN INTERACTION INTERFERENCE
Time-Object axis: Converting the time in x-axis into time in y-axis (matter of gradient of time)
Note that specific narrative for this artwork is TBD
Significance of this system: It connects visual state - system state successfully.
It also approaches from system-based approach (i.e. no single user, no linear narrative, no clear start or end, just an equilibrium and off-equilibrium dynamic state)
Each system state is closely connected with the visual state - digital clock, analogue clock, presentation of different clocks… Is significant
Also it closely & intuitively talks about the concept of time in an abstractive/interactive language
English Version (LLM-Generated)
The field of audio-visual composition already encompasses numerous systems and networks, with TouchDesigner being one of the most representative examples of a node-based audio/visual network. However, while these approaches excel at creating abstract audio-visual outputs, they often face limitations when addressing semantics or interfacing with other visual paradigms.
When constructing multi-layered system art, various methodologies can be adopted. One viable strategy is to draw references from established systems rather than starting from scratch. In many existing audio/visual configurations—particularly those found in TouchDesigner and kinetic art—“visual states” are defined in real time and interactively. In TouchDesigner, for instance, a network constructed from interconnected nodes processes inputs to generate a composite audio-visual output. Although the resulting composition may appear complex, it is ultimately a product of discrete states; as input variables change, so too does the output. Similarly, kinetic art often employs a modular design using unit components, such as lights, whose states (on/off, intensity, etc.) combine to form a cohesive system.
Analyzing and recomposing these states is vital in interactive and computational art, where complexity emerges from repeating and modularizing individual states. This principle, well-established in audio-visual networks, can be applied equally to systematic or semantic arts—the domain may differ, but the underlying foundation remains consistent. Establishing a strong connection between the system's semantic state and its visual state is essential; ultimately, it is necessary to visually render or express the systematic state.
For example, many traditional visual systems employ Boolean states, such as the binary on/off behavior seen in kinetic lighting designs. In a systematic context, envision multiple grids where each grid functions as a module that can be activated or deactivated to create an overarching visual composition. Techniques like those employed in the work of ≠ illustrate the efficacy of switching between different states, even if the internal states of each module are more complex. Similarly, the use of a black-and-white background composition can serve as a visual metaphor for binary logic systems. In many cases, depicting inner states of a module may require Boolean or binary representations, which can then be expanded into multiple discrete states (e.g., states A, B, C). For instance, a single semantic unit might have three distinct states corresponding to the selection of red, green, or blue channels in a visual representation. In another context, if there are four states, one might use directional cues (N, S, W, E) to encode the information.
Beyond discrete states, the translation of continuous variables into visual states is equally important. Visual states can be defined by attributes such as intensity, while systematic states can represent continuous numerical values—such as monetary amounts—through variations in color intensity, spatial arrangement, or even angles. In some cases, continuous variables can be thresholded into Boolean states (e.g., if a value exceeds a threshold, the result is “true,” otherwise “false”). An illustrative example of this interplay is found in the Space Odyssey scene where HAL targets sleeping pilots: textual indicators of “system malfunction” trigger corresponding shifts in the audiovisual display, demonstrating a successful synthesis of visual and systematic states.
Thus far, the discussion has centered on relatively simple, module-based states. However, as the association between visual and systematic states becomes better understood, the potential to construct more complex systems increases. Drawing inspiration from the intricate network structures in TouchDesigner, one might envision a parallel framework for system art based on graph theory—where vertices (V) represent states or nodes and edges (E) signify the relationships between them. In this context, nodes may include input nodes, pre-set system nodes, or context nodes, with edges defining the inter-nodal relationships.
It is important to underscore that this conceptual framework remains high-level and does not necessarily mandate a node-based structure in the final implementation. While the fundamental principles may mirror those of TouchDesigner’s node-based architecture, the graphical representation in system art is likely to be more conceptual, requiring further refinement to define the relationships between mathematical graphs and artistic systems.
In considering the “ingredients” of such a system, it is useful to note that audio/visual art traditionally incorporates audio and visual elements. In contrast, systematic states may consist of various elements, including texts, numbers (as seen in projects like Present Shock by UVA), generative images and videos, graphs (bar charts, dashboards, and combinations thereof), websites, commercial user interfaces (advertisements, business cards, flight information displays, chat interfaces), maps (either as singular or multiple modalities), avatars/profiles/agents, complex networks, and even three-dimensional modular structures. Each of these components can exhibit distinct states, providing a rich starting point for exploration.
To illustrate these ideas, consider the following thought experiment centered on the concept of time and its linearity. Imagine an initial aesthetic based on a grid layout where each module displays a digital clock in the HH:MM format, perfectly synchronized with real time. As users interact with the system—whether through spatial manipulation or other forms of engagement—the gradient or speed of time within each module begins to vary, visually indicating non-linearity and a distortion of spatiotemporal continuity. With intensified interaction, the digital clocks might gradually transition into analog displays, alternate digital designs, generative images or audio, graphs, or other diverse visual elements, reminiscent of the work by Christian Marclay. The resultant display would be chaotic, reflecting the different roles and speeds of time experienced by each module. When the interaction subsides or users disengage, the modules would slowly revert to their original state.
This example is predicated on a state-based approach rather than a traditional linear narrative; multiple interactions can amplify or interfere with one another, similar to the interference of multiple waves. In this context, converting the time on the x-axis to time on the y-axis becomes a matter of adjusting the gradient of time itself.
Although the specific narrative for this artwork remains to be fully defined, the significance of such a system lies in its ability to seamlessly connect visual and systematic states. It operates on a system-based approach, eschewing single-user experiences, linear storytelling, or clear beginnings and endings in favor of a dynamic equilibrium between order and chaos. Each systematic state is intrinsically linked to a corresponding visual state—whether it is represented by a digital clock, an analog clock, or another visual metaphor—allowing for an abstract yet interactive interpretation of time.
In summary, by building upon existing models in audio/visual composition and carefully mapping the relationship between system and visual states, artists and designers can develop sophisticated system art that transcends traditional narrative boundaries and engages audiences through dynamic, state-based visual interactions.
Korean Version (LLM-Generated)
아래는 원문의 내용을 전문적인 방식으로 한국어로 재작성한 것입니다.
────────────────────────────
오디오-비주얼 구성 내에는 이미 다양한 ‘시스템’ 혹은 ‘네트워크’들이 존재한다. 그 대표적인 예가 노드 기반의 오디오/비주얼 시스템 네트워크인 TouchDesigner이다. 다만, 이러한 오디오-비주얼 구성은 개념적(a/v abstraction)에 치우쳐 있으며, 순수 오디오-비주얼 요소를 넘어 의미론적 혹은 다른 시각적 인터페이스를 논할 때 한계를 보인다.
다층적 시스템 아트를 구성할 때는 다양한 접근 방식을 고려할 수 있다. 그 중 하나는 기존의 ‘시스템’을 참고하는 것이다. 이는 완전히 초기 상태에서 출발하는 것보다 좋은 출발점이 될 수 있다.
기존의 오디오/비주얼 시스템-구성물에는 이미 수많은 ‘시각적 상태’들이 존재한다. 일부는 실시간으로, 일부는 인터랙티브하게 작동하며, TouchDesigner 내부에서는 문자 그대로 노드 기반 시스템으로서 입력과 네트워크의 결합을 통해 오디오-비주얼 결과물을 만들어낸다. 이처럼 결과물이 아무리 복잡해 보이더라도 여러 상태의 조합으로 이루어지며, 입력 변수의 변화에 따라 출력도 그에 맞춰 변화한다. 키네틱 아트 역시 주로 단위 모듈(대표적으로 조명)이 켜짐, 꺼짐, 강도 변화 등의 ‘상태’를 반복적 혹은 모듈화하여 전체 시스템을 구성하는 방식으로 이루어진다.
인터랙티브 혹은 컴퓨테이셔널 아트에서는 이러한 상태들을 분석하고, 이들의 반복 및 모듈화를 바탕으로 복잡한 시스템을 구성하는 것이 중요하다. 오디오-비주얼 네트워크를 구성하는 규칙은, 비록 도메인이 다르더라도, 시스템적/의미론적 아트에도 유사한 방식으로 적용될 수 있다.
또한 시스템-의미 상태와 시각적 상태 간의 연관성을 명확히 하는 것이 중요하다. 결국에는 시스템 상태를 시각적 혹은 오디오-비주얼 형식으로 표현해야 하기 때문이며, 이 상호 연결성을 세심하게 이해하고 구성하는 것이 필수적이다.
예를 들어, 기존의 시각적 상태에서는 불리언 상태(Boolean state)가 많이 활용된다. 대표적인 사례로 키네틱 아트에서 조명의 켜짐/꺼짐 상태가 있다. 시스템 상태에서도 여러 그리드가 각각 하나의 모듈로 존재한다고 상상해볼 수 있다. 각 모듈이 주기적으로 켜짐과 꺼짐을 반복함으로써 전체적인 시각적 구성을 만들어내거나, 서로 다른 상태 간 전환을 통해 복합적인 구성을 이룰 수 있다. 또한, ‘흑백 배경(B <-> W)’ 구성 역시 시각적 plotting에서 대표적인 방식이다. 의미론적으로 모듈의 내재적 상태를 표현하기 위해 불리언 혹은 이진 시스템을 사용하는 경우가 많으므로, 이러한 전략은 효과적일 수 있다.
이러한 이산적 상태(0/1)는 확장되어 (0-n) 이산 상태, 예를 들어 상태 A, B, C 등으로 세분화될 수 있다. 예를 들어, 하나의 의미 시스템 단위가 세 가지 서로 다른 상태를 가질 수 있으며, 이는 시각화할 때 R, G, B 채널의 선택에 대응할 수 있다. 만약 4가지 상태가 존재한다면, 이를 시각적으로 N, S, W, E 등의 방식으로 표현할 수 있다.
연속적인 상태나 연속 변수의 경우도 고려해볼 수 있다. 시각적 상태에서는 ‘강도(intensity)’가 대표적이며, 시스템 상태에서는 예를 들어 금액($)과 같이 특정 수치 값을 시각적으로 표현해야 하는 경우가 많다. 이 경우에는 색상의 농도, 공간, 각도 등으로 표현하거나 데이터 소니피케이션(data sonification)을 적용할 수 있다. 또는 임계값(threshold)을 설정하여 연속 변수를 불리언 값으로 전환하는 방식도 가능하다(예: V > Threshold 인 경우 true/false).
가장 대표적인 사례로, 영화 『2001 스페이스 오디세이』의 HAL이 잠든 조종사들을 제거하는 장면을 들 수 있다. 이 장면에서는 텍스트가 ‘시스템 오류’로 전환되고, 이에 따라 그래프가 반응하는 방식으로 시각적 상태와 시스템 상태가 결합되는 과정을 보여준다.
지금까지 비교적 단순한 상태, 즉 개별 모듈 기반의 상태에 대해 논의했다. 그러나 시각적 상태와 시스템 상태의 명확한 연관성이 파악된다면 훨씬 복잡한 시스템을 구성하는 것도 가능하다. TouchDesigner에서 복잡한 시각적 시스템과 네트워크가 존재하는 것처럼, 의미론적 시스템 역시 이와 유사한 경로를 따를 수 있다.
이러한 복잡한 시스템으로의 확장을 위해, TouchDesigner의 네트워크를 참고하여 시스템 아트를 위한 유사한 네트워크, 즉 그래프 이론의 G(V, E) 구조를 도입할 수 있다. 여기서 V는 상태 혹은 노드를 나타내며, E는 노드 간의 관계(엣지)를 정의한다.
- V → 입력 노드, 시스템 사전 설정 노드, 컨텍스트 노드 등
- E → 노드 간의 관계를 정의하는 요소
이 접근 방식은 매우 고차원적인 개념적 접근이며, 실제 노드 기반 구조 자체를 의미하는 것은 아니다.
즉, 시스템 아트가 반드시 노드 기반 구조를 가져야 한다는 의미는 아니다. 기본 원칙은 동일할 수 있으나, 그래픽적 구조는 TouchDesigner의 노드 기반 UI와는 달라야 한다. 왜냐하면 시스템 아트에서의 그래프는 개념적(Conceptual)인 성격을 띠기 때문이며, 수학적 그래프와 시스템 아트 간의 관계는 추가적으로 정의되어야 한다.
또한 ‘재료(ingredients)’의 전환에 대해서도 논의할 필요가 있다. 오디오/비주얼 아트에서는 음향과 영상이 재료로 사용된다. 반면, 시스템 상태에서는 다음과 같이 범위를 확장할 수 있다.
ㆍ 텍스트 (이미 많은 사례가 존재함)
ㆍ 숫자 (Present Shock – UVA 사례 등)
ㆍ 생성적 이미지/비디오 (다양한 사례가 존재함)
ㆍ 그래프 (막대 그래프, 차트, 대시보드 등 결합)
ㆍ 웹사이트
ㆍ 상업적 UI – 광고, 명함, 항공편 정보, 채팅 UI 등
ㆍ 지도 (여러 지도 혹은 단일 지도 내 다양한 모달리티)
ㆍ 아바타/프로필/에이전트
ㆍ 복합 네트워크
ㆍ 3D 구조 (최신 기술 수준처럼 모듈화된 구성)
이 외에도 웹 프레임워크 내에서 폭넓게 소통 가능한 모든 요소들이 재료가 될 수 있으며, 이들 각각은 시각적 상태를 지닐 수 있다. 이러한 접근 방식은 시스템 아트를 구성하는 좋은 출발점이 될 수 있다.
────────────────────────────
[사고 실험: 하나의 예시]
추상적/개념적 시간(시간의 선형성)에 관한 예시를 들어보자.
ㆍ 미적 구성: 그리드 레이아웃 – 모든 모듈이 처음에는 디지털 시계(HH:MM) 형태로 구성됨
ㆍ 초기 상태: 디지털 시계 HH:MM이 실제 시간과 동기화되어 있음
ㆍ 사용자 인터랙션 발생 시: (구체적인 인터랙션은 추후 정의) 각 시각 모듈의 좌표(x, y)에 따라 시간의 경사나 속도가 달라짐
→ 이로써 시간의 비선형성과 상호작용에 따른 시공간적 왜곡이 표현됨
ㆍ 인터랙션이 강화되면: 각 시각 모듈이 원래의 디지털 시계 HH:MM에서 벗어나 1) 아날로그 시계, 2) 다양한 디자인의 디지털 시계, 3) 생성적 이미지/오디오, 4) 그래프, 5) 기독교적 마클레이(Christian Marclay) 등 다양한 시각 요소로 전환됨
ㆍ 인터랙션 종료 혹은 사용자가 떠나면: 각 시각 모듈이 점차 원래 설정(디지털 시계 HH:MM, 실시간 동기화)으로 복귀함
ㆍ 다수의 사용자가 동시에 참여하면: 상호작용이 증폭되며, 이는 마치 두 개 이상의 파동이 간섭하는 것과 같이 ‘파동 간섭’ 혹은 ‘상호작용 간섭’ 현상을 보여줌
여기서 시간-객체 축은 x축의 시간을 y축의 시간으로 전환하는 것으로, 시간의 경사(gradient)를 나타내는 방식으로 해석할 수 있다. (구체적인 서사는 차후 결정됨)
이 시스템의 의의는 시각적 상태와 시스템 상태의 결합에 있으며, 동시에 단일 사용자나 선형적 내러티브가 아닌, 균형 및 비균형 동적 상태를 기반으로 한 시스템적 접근법을 보여준다는 점이다. 각각의 시스템 상태는 디지털 시계, 아날로그 시계, 다양한 디자인의 시계 등 시각적 상태와 긴밀히 연관되어 있으며, 이를 통해 사용자는 추상적이면서도 인터랙티브한 언어로 시간 개념을 직관적으로 체험할 수 있다.
────────────────────────────
요약하면, 오디오-비주얼 네트워크 구성의 원칙과 모듈화, 상태 기반 접근법은 의미론적 시스템 아트에도 효과적으로 적용될 수 있으며, 이를 위해서는 시각적 상태와 시스템 상태의 명확한 연관성을 규명하고, 필요한 경우 그래프 이론적 접근 및 다양한 재료들의 조합을 통한 새로운 표현 방식을 모색해야 한다.
Tags
Time Theory
System Art
Quantum Mechanics
Interactive Time
Relational Art
Digital Philosophy
Time-Based Art
System States
Physics Art
Interactive Systems
Temporal Design
Web-Based Art
Multi-Device Art
State Dynamics
Digital Installation
Quantum Art
Time Perception
System Theory
Interactive Design
Theoretical Physics
Interactive Systems
State-Based Art
System Art
Multi-Device Web Artwork
System Dynamics
User Interaction
System Architecture
Digital Aesthetics
Interaction Theory
Interactive Narratives
Visual States
System Networks
Node-Based Systems
State Dynamics
Digital Installation
Modular Art
System Theory
Graph Theory
Network Art
State-Based Design
Digital Aesthetics
System Composition
Visual Networks
Interactive Design
State Visualization
System Art
Network Theory
Text written by Jeanyoon Choi
Ⓒ Jeanyoon Choi, 2024